Measurement Uncertainty (MU) in Haematology
What is measurement uncertainty?
With every result produced by a laboratory there is an associated uncertainty, which may be attributed to a number of small variations arising at any stage of the analytical process, from sample collection to analysis. It is important to understand that uncertainty is not the same as an error. An error implies that there is a difference between a measured value and the true value caused by an unknown factor, whereas uncertainty is an acceptable interval within which a result can fall. We are able to predict this interval by calculating the measurement uncertainty (MU) for tests within our repertoire.
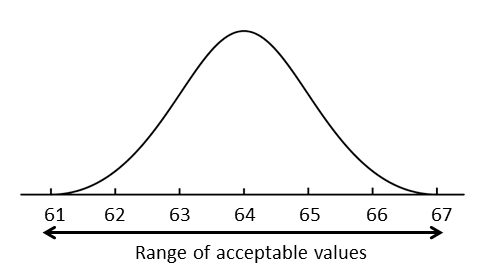
For example, if a “Hb” result of 64 g/L is reported by the laboratory with a MU of 0.98, the result could actually lie somewhere between 63 and 65 g/L once MU is considered (figure 1).
Why are we reporting uncertainty?
By estimating and reporting uncertainty, the laboratory can indicate the quality and reliability of the result produced.
This information can then be used by clinicians and service users to compare a result to a cut-off limit or to a previous result from a sample on that same patient. Such information can be used by a clinician to determine whether the difference between two results is negligible due to uncertainty or significant due to a change in the condition of the patient. Without an estimate of MU, results cannot be compared either to previous results or reference values.
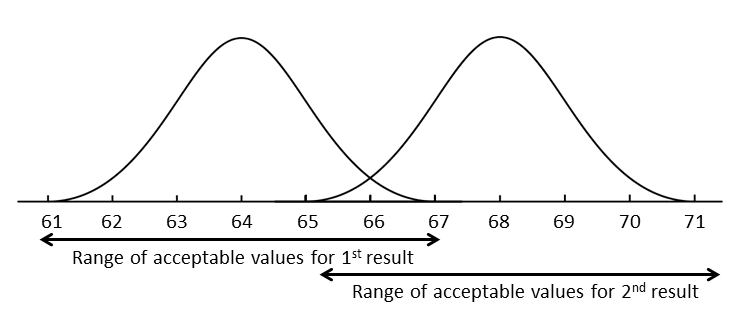
When there is a small change in the results, for example a change in Hb from 64 to 66 g/L, the range of acceptable values surrounding the two results may overlap (see figure below). The closer these results lie together the less likely they are to be significant but by knowing the MU we can be more confident in our ability to interpret the results.
Where there is no overlap, for example a change in Hb from 64 to 73 g/L, we can be certain that a true change has occurred (see figure below).
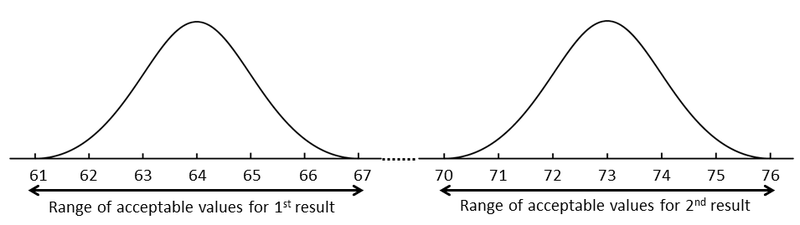
The patient can then either be monitored or treated depending on any clinical cut-off limits that surround this result.
Expanded measurement uncertainty values for tests we perform
The table below shows the %MU for each test currently performed in Haematology, Immunology and Blood Transfusion, across the two laboratory sites. The %MU is the actual MU expressed as a % of the mean. So, if a result is 50 with an MU of 5 the value could be 5% higher or lower than the value so between 47.5 and 52.5 in this example. But if the result was lower, for example 2, the result would fall between 1.9 and 2.1.
| Test | %CV |
|---|---|
| Full Blood Count | |
| WBC | 1.54 |
| RBC | 0.9 |
| HGB | 0.98 |
| HCT | 1.19 |
| MCV | 0.84 |
| MCH | 1.12 |
| MCHC | 1.16 |
| RDW | 1.25 |
| PLT | 1.66 |
| MPV | 0.8 |
| NE# | 1.99 |
| LY# | 2.86 |
| MO# | 5.33 |
| EO# | 0.06 (SD) |
| BA# | 0.008 (SD) |
| NRBC# | 0.04 (SD) |
| RETIC# | 4.71 |
| Diluted FBC HB | 6.7 |
| Manual differential | 4.4 (SD) |
| Plasma viscosity | 1.6 |
| ESR | 12 |
| Malaria % Parasitaemia | 11.8 |
| Test | %CV |
|---|---|
| APTT | 1.93 |
| PT | 2.26 |
| D-Dimer | 4.79 |
| Clauss Fibrinogen | 6.69 |
| FVII | 3.15 |
| FVIII | 9.65 |
| FIX | 5.58 |
| FXI | 8.58 |
| FXII | 5.33 |
| Free Protein S | 4.45 |
| Protein C | 2.42 |
| Anti-Thrombin | 5.44 |
| DRVVT | 4.35 |
| DRVVT Confirm | 6.91 |
| Anti-Xa LMWH | 4.09 |
| Anti-Xa UFH | 5.09 |
| APTT 50:50 Corrections | 1.3 |
| FVL | 2.5 |
| PMG | 2.1 |
| Test | %CV |
|---|---|
| Ferritin | 6.2 |
| Serum Folate | 6.7 |
| Vitamin B12 | 8.0 |
| IF Antibody | 5.3 |
| Test | %CV |
|---|---|
| Hb A2 | 2.1 |
| Hb F | 3.9 |
| Test | %CV |
|---|---|
| Allergy | |
| Total IgE | 9 |
| Specific IgE (d1) | 8.3 |
| Specific IgE (e1) | 8.2 |
| TTG IgA | 8.4 |
| Anti-TPO | 6.7 |
| Anti-cardiolipin | 7.1 |
| dsDNA Antibodies | 10 |
| ENA screen | 8.7 |
| SSA (Ro) | 9.1 |
| SSB (La) | 11.3 |
| nRNP | 7.8 |
| Sm | 6.1 |
| Scl70 | 7.4 |
| Jo-1 | 7.4 |
| CCP | 7 |
| Anti-centromere | 5.3 |
| Proteins | |
| IgG | 3.8 |
| IgA | 2.3 |
| IgA Low Level | 1.8 |
| IgM | 2.5 |
| IgM Low Level | 2.6 |
| Complement C3 | 1.7 |
| Complement C4 | 2.2 |
| Haptoglobin | 1.7 |
| Alpha 1 Antitrypsin | 2.9 |
| Rheumatoid Factor | 3.9 |
| Total Protein (serum) | 1.5 |
| Electrophoresis | |
| Albumin | 0.8 |
| Alpha 1 | 4.8 |
| Alpha 2 | 2.5 |
| Beta 1 | 2.2 |
| Beta 2 | 3.3 |
| Gamma | 1.9 |
| Test | %CV |
|---|---|
| Kleihauer | 31 |
Updated: January 2025